Analytics Dashboards
Monitor fraud KPIs and operational metrics in RiskOS™ using Business and Operations dashboards with date filters and drill-down views.
Fraud and risk analytics are essential for businesses to understand fraud-related activities and make informed decisions. RiskOS™'s advanced analytics dashboard provides an overview of key fraud-related KPIs, helping identify areas of risk and opportunities for improvement. These insights support the development of strategies to mitigate fraud risks, reduce fraudulent activity, improve operational efficiency, and enhance the customer experience.
Dashboards are organized by modules within the dashboard section of the product. Each module has its own set of dashboards.
Dashboard types
There are two dashboard sections in RiskOS™: Business Dashboard and Operation Dashboard.
Business Dashboard
The Business Dashboard displays important KPIs related to business and risk. This is a good place to start for a high-level overview of automation rates and overall business performance.
Operation dashboard
Operational KPIs appear on the Operation Dashboard. You can use the data collected here to make several operational efficiency improvements.
Dashboard customization and data freshness
Customizing Dashboards
Dashboards in RiskOS™ are customized at the chart level. Each chart can be configured to display specific data based on your needs.
You can customize charts using:
- Filters (for example, date ranges, workflow segments, or decision outcomes)
- Metric selections and aggregations
- Query expressions (such as date-based functions)
These configurations allow you to tailor dashboards to:
- Focus on specific time periods
- Segment data by workflow or population
- Analyze trends and performance metrics relevant to your business
Note: Dashboard layouts themselves are not user-configurable. Customization is applied within each chart.
Data freshness & caching
Dashboard data is cached to optimize performance.
- Each chart reflects data from the most recent cache
- The last updated timestamp is displayed in the dashboard UI
- You can manually refresh a chart to retrieve the latest available data
Cache refresh intervals are managed by the system and may vary, so dashboards should be considered near real-time rather than real-time
Dashboard features
Date filters
The Dashboard can be filtered by changing the date range. Once a range is selected, only data within that range will be displayed. There is a specific syntax for the date filter in Range Type advanced.
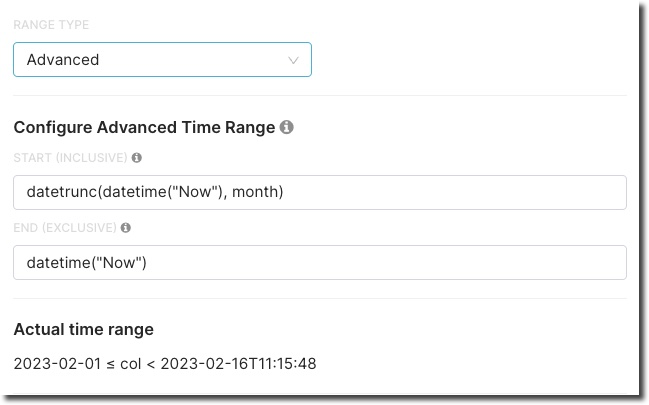
| Example | Syntax | Description |
|---|---|---|
| datetime("2023-01-01 12:00:00") | datetime([string]) | Return a specific datetime |
| datetime("Now") | datetime([string]) | The current timestamp |
| dateadd(datetime("today"), -13, day) | dateadd([datetime], [integer], [dateunit]) dateunit = (year, quarter, month, week, day, hour, minute, second) | Move the given date by a specific interval |
| datetrunc(datetime("2023-01-01 12:00:00"), week) | datetrunc([datetime], [dateunit]) dateunit = (year, month, week) | Truncate the specified date to the accuracy specified by the date unit |
| lastday(datetime("today"), month) | lastday([datetime], [dateunit]) dateunit = (year, month, week) | Get the last date for the specified date unit |
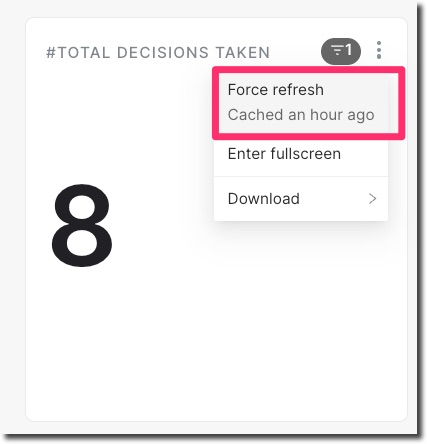
Refreshing chart cache
If Dashboard data appears out of sync, you can refresh the chart cache to retrieve the latest available data. To force a refresh, click the menu icon next to the chart. You can also see when the data was last cached.
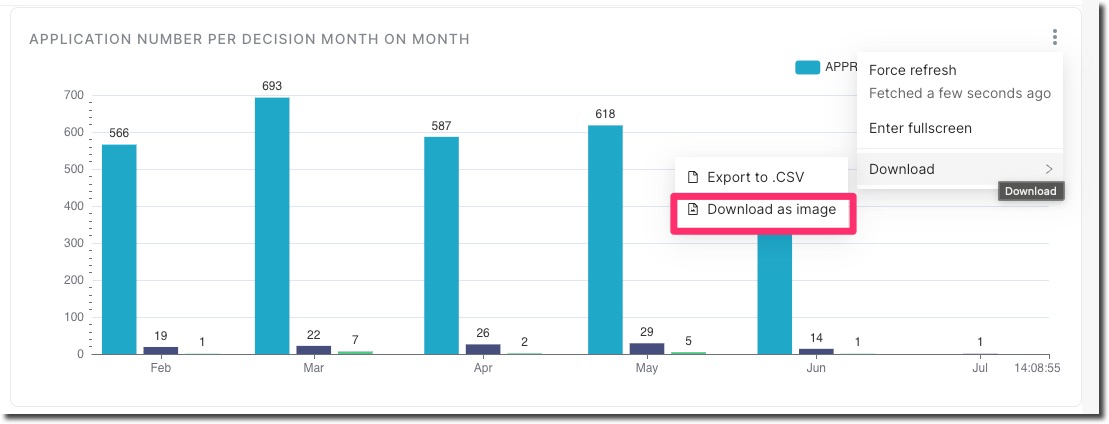
Download Dashboard data
RiskOS™ Dashboards allow you to download chart data as a CSV file or as an image. This can be done from the context menu of each chart. Only the data visible in the chart will be included in the download.
Updated 22 days ago